2020 Census NOVA
Designing a comprehensive campaign to drive census participation through education and community engagement.
Summary
Census data decides how federal funding reaches a community for the next ten years, from schools and roads to healthcare and public services. Northern Virginia reached a 74% self-response rate in 2010, but that still left about 172,000 households at risk of not being counted in 2020. Many were in hard-to-count communities: immigrant families, renters, non-English speakers, and busy residents who didn't see why the census mattered to them. Most people understood the census was important in general. Few saw the direct line between filling it out and the quality of services in their own community.
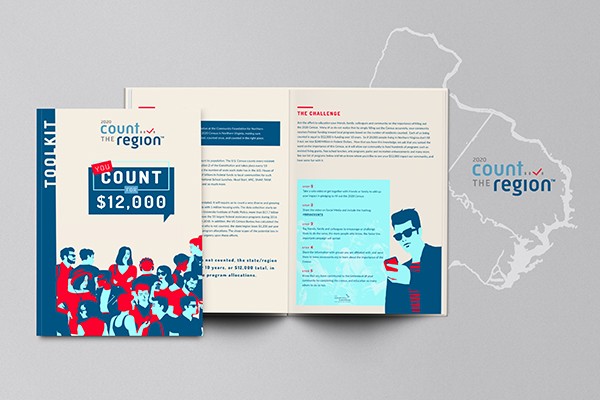
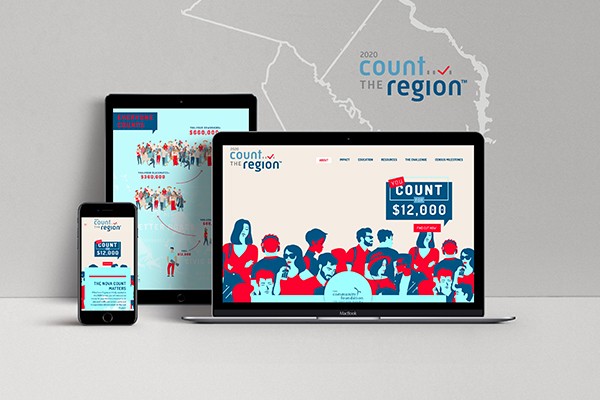
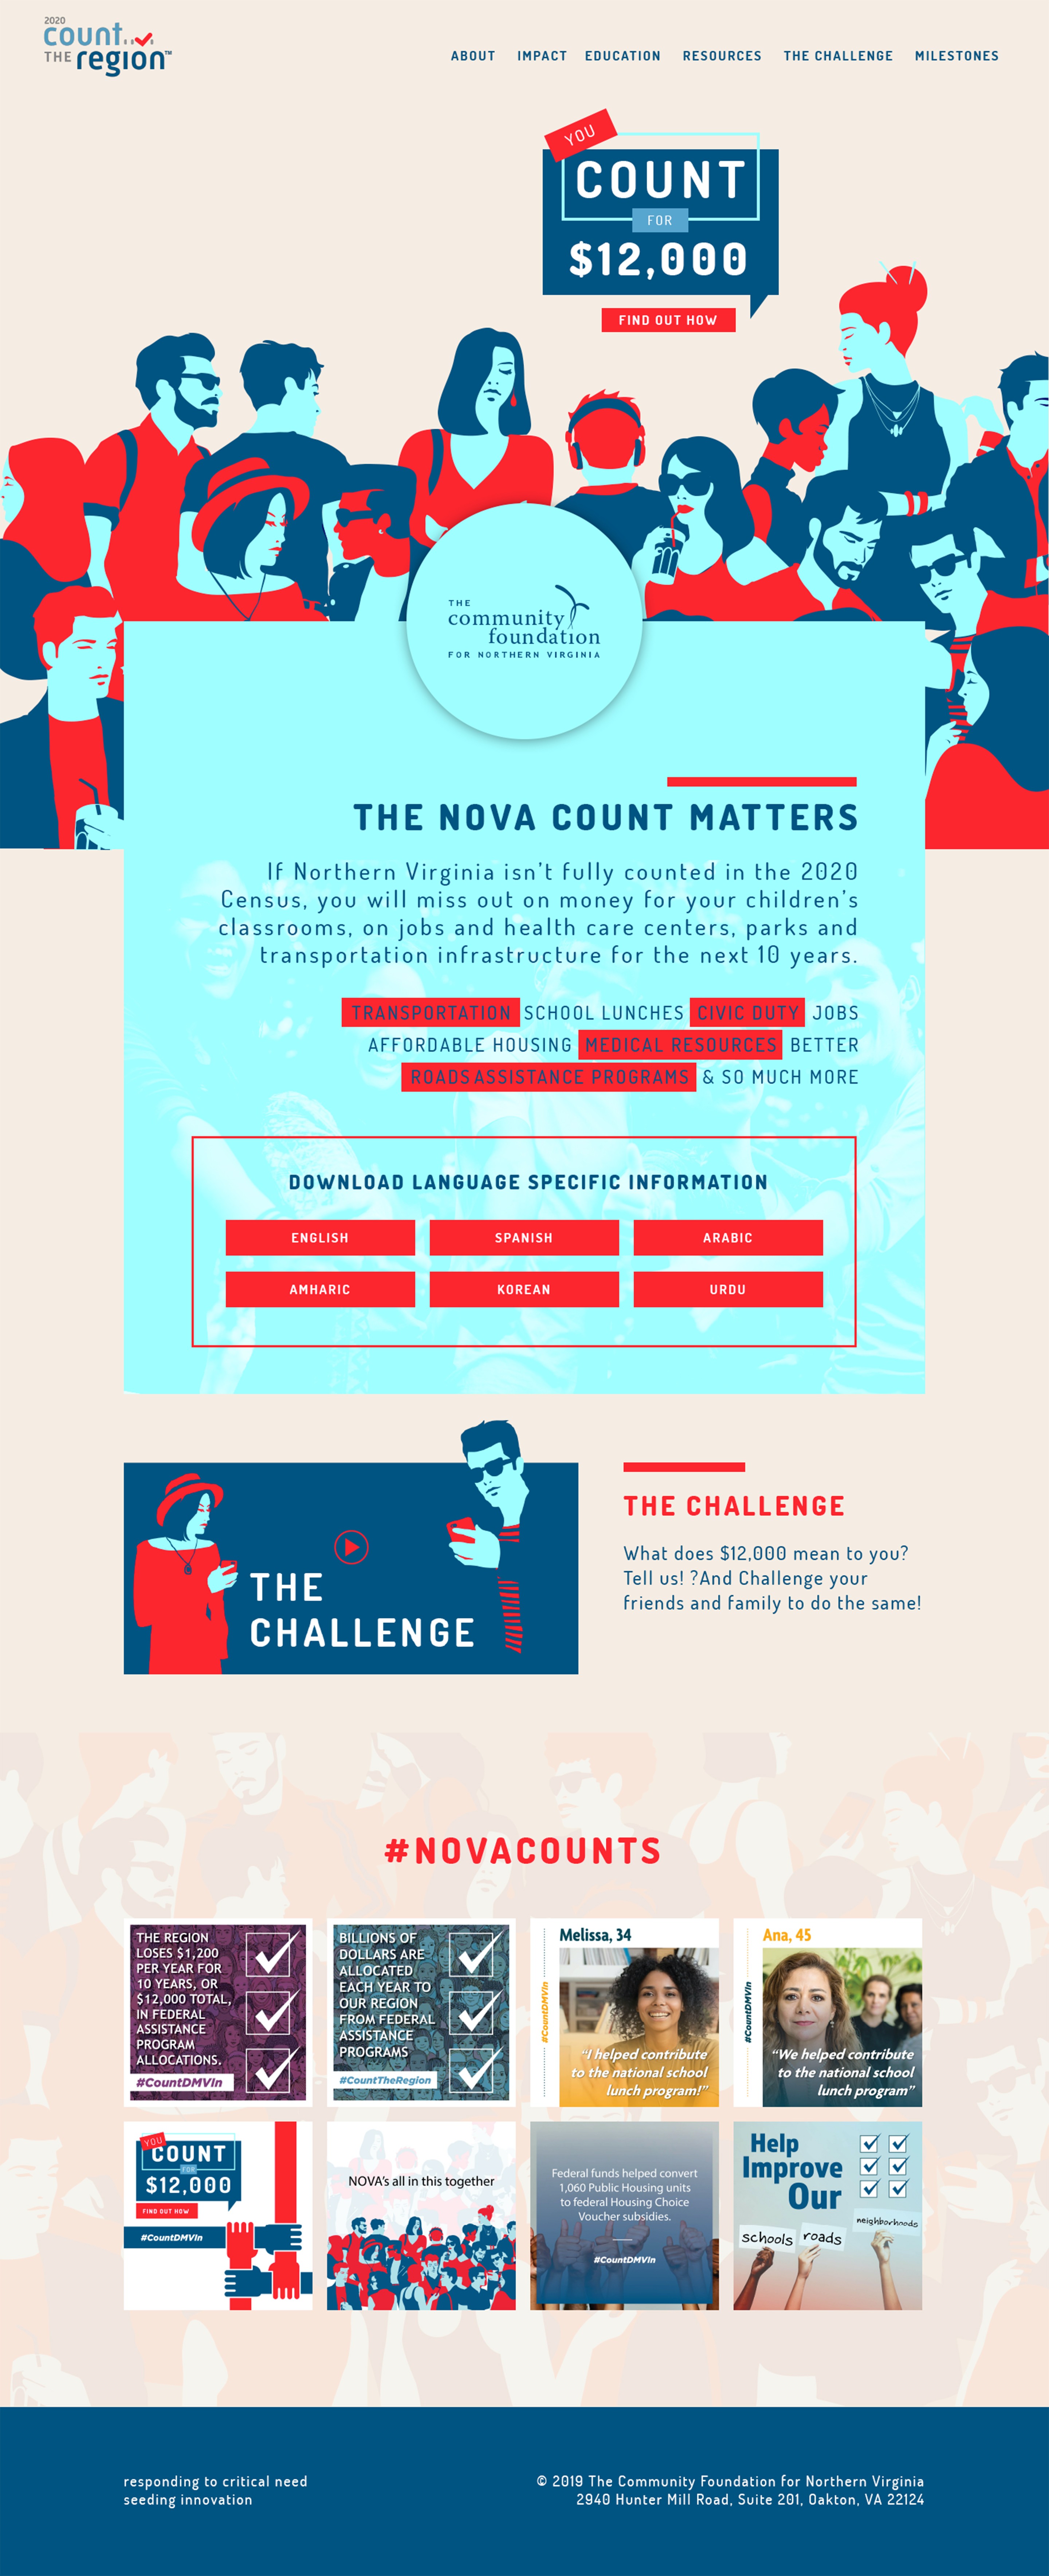
Working with the Community Foundation for Northern Virginia, I designed Count The Region, a public awareness campaign built to make that connection personal. Instead of abstract messages about civic duty, the campaign focused on outcomes residents cared about: better-funded schools, improved roads and less congestion, accessible healthcare, and well-kept parks. I designed the campaign website as a central hub that explained why participation mattered, addressed privacy concerns, and made responding easy. I also created a library of social media posts partners could share, each focused on one clear benefit. I helped design and script educational videos showing how individual responses turn into funding, for use online, at community events, and by local organizations.
The visual design had to feel approachable and inclusive while carrying the credibility of an official regional initiative. It also had to work across a varied region, from urban Arlington and Alexandria to suburban Fairfax and Loudoun and more rural areas beyond. The name itself framed participation as a shared effort: counting not just your neighborhood, but the whole region.
Outcomes
- Higher participation. Northern Virginia reached a 79% household self-response rate in 2020, up 5 percentage points from 74% in 2010.
- Gains where they mattered most. Hard-to-count tracts reached a 70% self-response rate, up 2.1 points, even as response in hard-to-count areas declined nationally.
- Complex policy made personal. Focusing on tangible outcomes rather than funding formulas answered the question every resident asks: "Why should I care?"
- One message, many channels. Consistent branding across the website, social media, and video meant residents recognized the campaign wherever they encountered it.
Artifacts
- Campaign Website
- Social Media Asset Library
- Educational Videos
- Educational Materials
Methods
- Campaign Strategy
- Messaging & Content Design
- Visual Design
- Multi-Channel Design